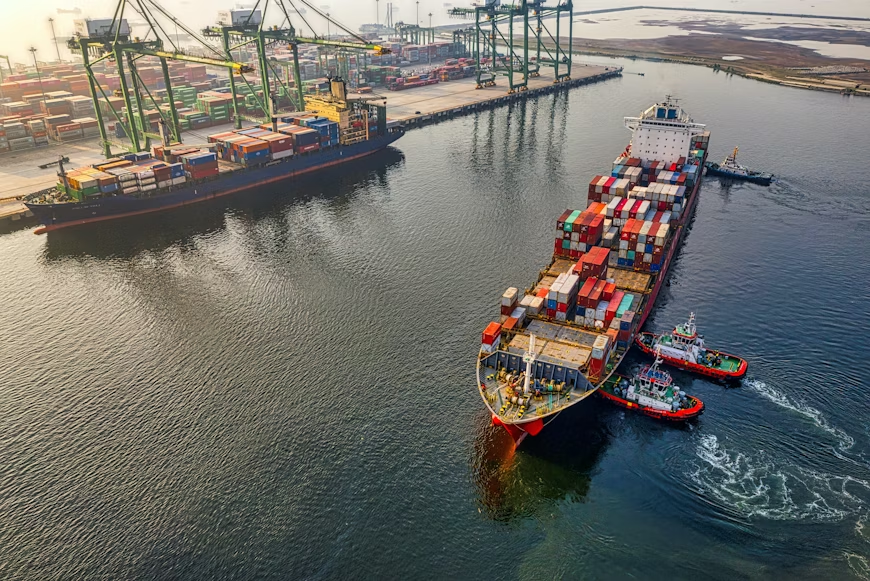
In the world of supply chain management and international trade, keeping a close eye on the cargo volumes passing through U.S. ports has become essential for deciphering economic trends. These maritime gateways serve as crucial arteries of commerce, and the numbers they generate offer valuable insights into the nation’s economic health. In this article, we will dive into the significance of monitoring port volumes and how they reflect the broader trade landscape.
The Port Pulse: A Vital Economic Indicator
The Department of Transportation’s data for 2022 revealed a startling fact – U.S. maritime gateways played a pivotal role in handling a staggering 40% of the international freight value. This statistic underscores the importance of tracking seaport volumes as a barometer for understanding trade trends over months and years, not just within the coastal regions but throughout the nation.
Consider the impact of the coronavirus pandemic on these trends. From 2018 to 2020, the top 12 U.S. seaports collectively juggled approximately 46 million twenty-foot equivalent units (TEUs) of cargo. The TEU, a standard unit for measuring cargo capacity, became a unit of measure for the rapid rise in cargo volumes during 2021 and 2022. During this period, the volumes surged to over 53 million TEUs, resulting in infamous congestion and logistical delays at the ports.
Now, as we stand in 2023, the volumes have returned to a semblance of pre-pandemic normalcy. However, the question lingers – will containerized trade conclude the year above or below 2019 levels? To answer this, experts are closely monitoring the monthly cargo volume data, which can provide vital insights into the trajectory of trade.
The Data Tracker: Navigating Trade Trends
To gain a clearer perspective on the situation, we encourage you to utilize the data tracker provided in the chart below. This tool offers an overview of total volumes for the top twelve U.S. ports, with real-time updates as the data becomes available. To delve deeper into historical insights and sort the data according to your specific interests, simply scroll down and apply filters on the left. You can refine the information by port, coast, or month, allowing for a comprehensive analysis of the trends shaping the nation’s maritime trade.
The fluctuations in port cargo volumes, as demonstrated in the data, act as a bellwether for the broader economy. By monitoring these numbers, supply chain managers, economists, and businesses gain the ability to adapt and make informed decisions in a dynamic and ever-changing global marketplace. Whether it’s the surges brought about by a global pandemic or the gradual return to normalcy, the ebb and flow of maritime cargo volumes are a vital source of insight into the pulse of the U.S. economy.
Get the latest supply chain report news insights at The Supply Chain Report. For international trade resources, visit ADAMftd.com.
#SupplyChainManagement #USPorts #CargoVolumes #InternationalTrade #PortPulse #TradeTrends #EconomicIndicator #MaritimeGateways #FreightValue #ContainerizedTrade #TEU #PandemicImpact #LogisticsChallenges #PortVolumes #TradeLandscape #DataTracker #SeaportInsights #CargoCapacity #USMaritime #TradeDataAnalysis #PortCongestion #ShippingTrends #GlobalTrade #LogisticsInsights


